The Stock Market Is Less Disconnected From the “Real Economy” Than You Think
Stock Market Indices Aren't The Stock Market
I thank Sonu Varghese for the data and charts in this article.
By this point it's a tired cliche of economic commentary that the stock market is “disconnected from the real economy”. A few weeks ago the Financial Times adviser ran an article with the headline "investors look to bonds as equities 'detach' from reality”.
It’s not just news articles though. Heather Boushey, “unofficially” one of Biden's top economic advisers according to the New York Times, had an op-ed in the Washington Post ominously entitled “The stock market is detached from economic reality. A reckoning is coming.” A strange thing happens when you get towards the end of these articles, though. It turns out, the “stock market” isn’t as disconnected as it may seem at first blush.
Boushey says in the seventh paragraph that:
It’s not just that indexes such as the S&P 500 — representing 500 of the largest — skew big. It’s also that a subset of truly giant corporations is driving market gains. The S&P 500’s increases have been led by five companies: Apple, Amazon, Microsoft, Facebook and Google’s parent, Alphabet.
Yet, Boushey doesn’t follow up on this point. The dominance of a handful of huge firms gets lost in a series of claims about how the Federal Reserve is boosting the stock market by “speculation”.
The key issue here is that people reference what is happening with the “stock market” all the time, but what they usually mean is “stock market indices”. In this vision, these indices “tell us” what’s going on with stocks. So if they are up that means “stocks are up”, and if they are down “stocks are down". This may seem to offer a simple and reliable guide, but does it?
The trouble with this kind of thinking is that these indices self-perpetuate trends. Companies' relative places in these indices are weighted by the total value of all their outstanding stocks, referred to as “market capitalization”. Thanks to this, trends in price indices are exaggerated relative to actual stock prices. Stocks that go up in value become a bigger part of the index, while stocks that fall in value inherently shrink.
In this kind of structure, indices will only represent overall economic trends when stocks nearly uniformly rise or fall together.
In the Coronavirus Depression, this is inherently unlikely because social distancing and shutdowns radically change consumption patterns. These conditions boost sales for specific industries and collapse sales for others. This is what’s driving tech stocks: their sales have simply been greatly boosted.
While it’s certainly the case that there has been momentum trading, and that these stocks may have gotten over-priced at specific points, it’s hard to tell a narrative about elevated speculation driving these trends. Why that, rather than the more typical process by which sudden changes in economic circumstances lead to adjustment, overshooting and readjustment?
This means to really glean information about what’s happening with the stock market, we must disaggregate the indices.
Disaggregating the S&P 500.
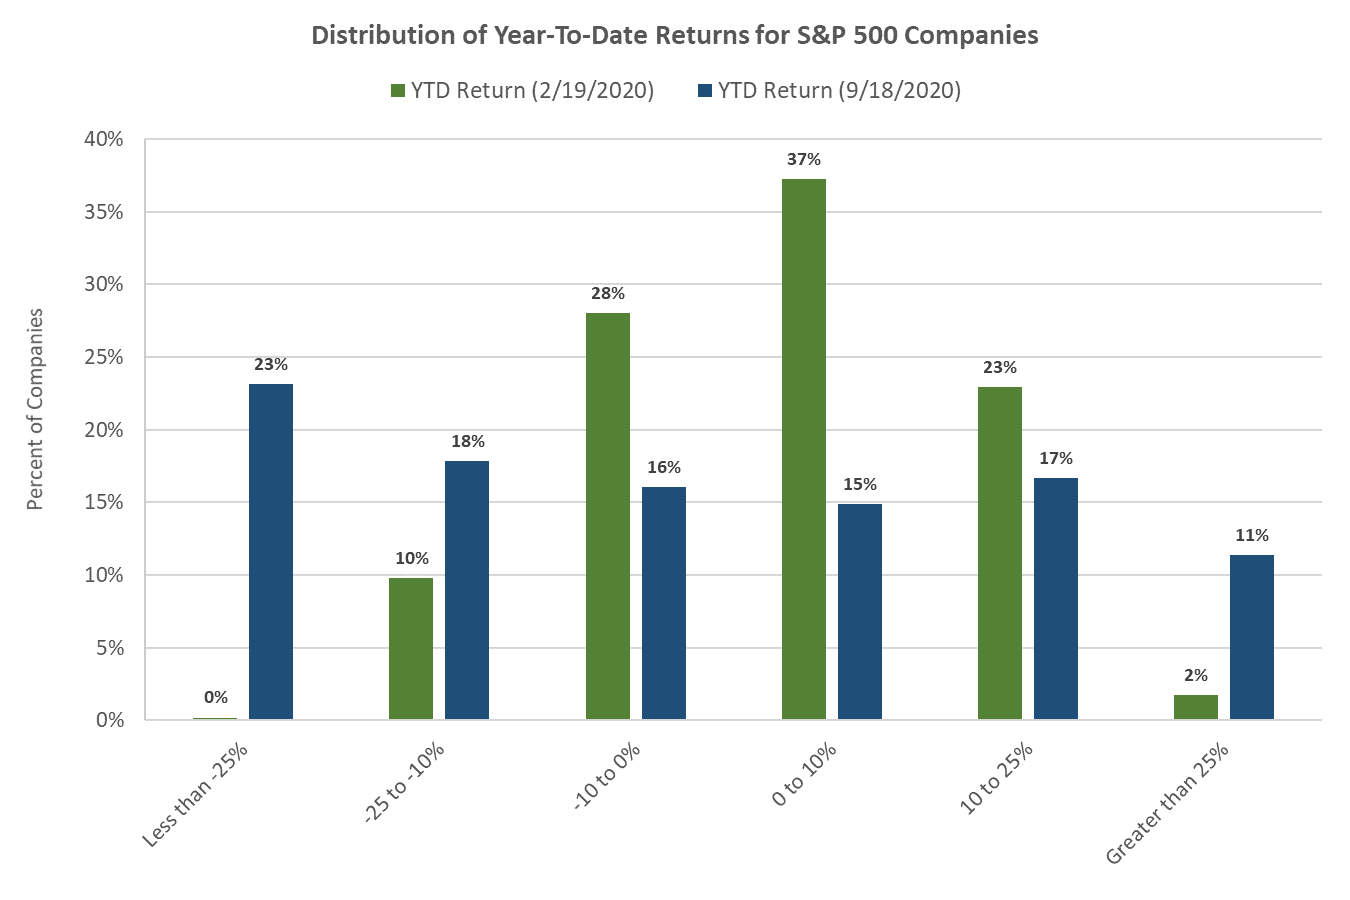
To start with, it’s worth pointing out just how many companies listed in the Standard and Poors stock index have seen negative returns on their outstanding stock. Our first chart of the S&P 500 index compares the distribution of returns as of 9/18/2020, compared to 2/19/20 (when the index hit a high prior to the crash). 57% of companies in the index saw negative returns since the beginning of the year as of 9/18, compared to just 38% back in February.
In this graph, you can see in the data that companies have really gone wildly different directions as a result of the pandemic. Only 10% of S&P 500 companies had returns less than -25% in February, compared to 23% as of 9/18. At the top of distribution of returns, less than 2% of companies were up more than 25% in February, versus 11% now.
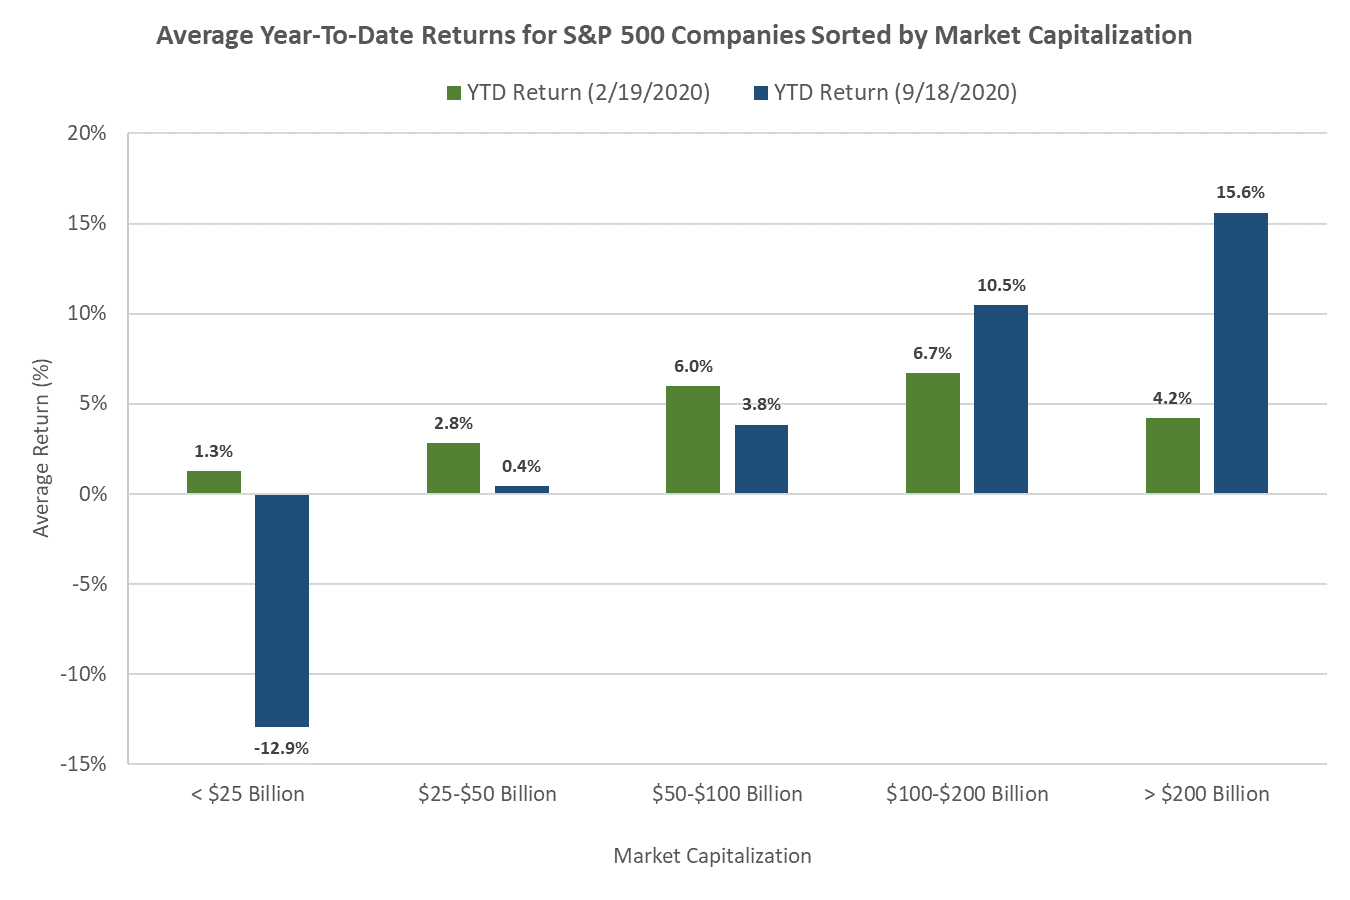
There is one big area you can say that the stock market is disconnected from the economic outlook— size. By definition, it tends to be bigger companies which are on the stock market. So inevitably the stock market can’t capture the thousands of small businesses that are failing. Yet, even here, disaggregation of the S&P tells us a lot. Again, there is a wide and sharp dispersion right now, with average returns for large firms a lot higher than smaller firms. This wasn’t the case in February. More than half the companies in the index have less than $25 billion in market capitalization, and the average year-to-date return for all these companies (equally-weighted) is negative.
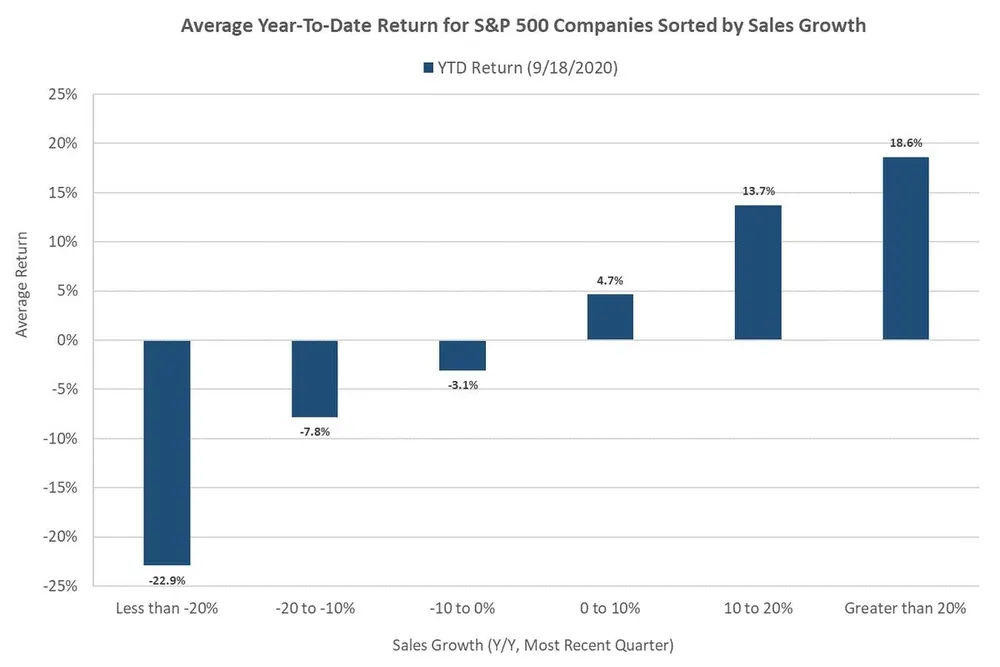
The clearest indication that the stock market is being driven by economic fundamentals is that growth and declines in sales so easily explain stock market returns. If stock market returns and the “real economy” were very disconnected, we’d expect the sales factor to be submerged in a sea of speculation. Instead, the chart below shows us another story. Once returns are broken down by sales growth, we see dramatic differences based on sales growth and decline. Returns are in fact highest for companies with the strongest year-over-year sales growth. Among those with sales growth greater than 20% are familiar companies like Amazon and Netflix, but also much smaller companies like Nvidia and Paypal. In other words, tech stock returns are being driven by tech sales.
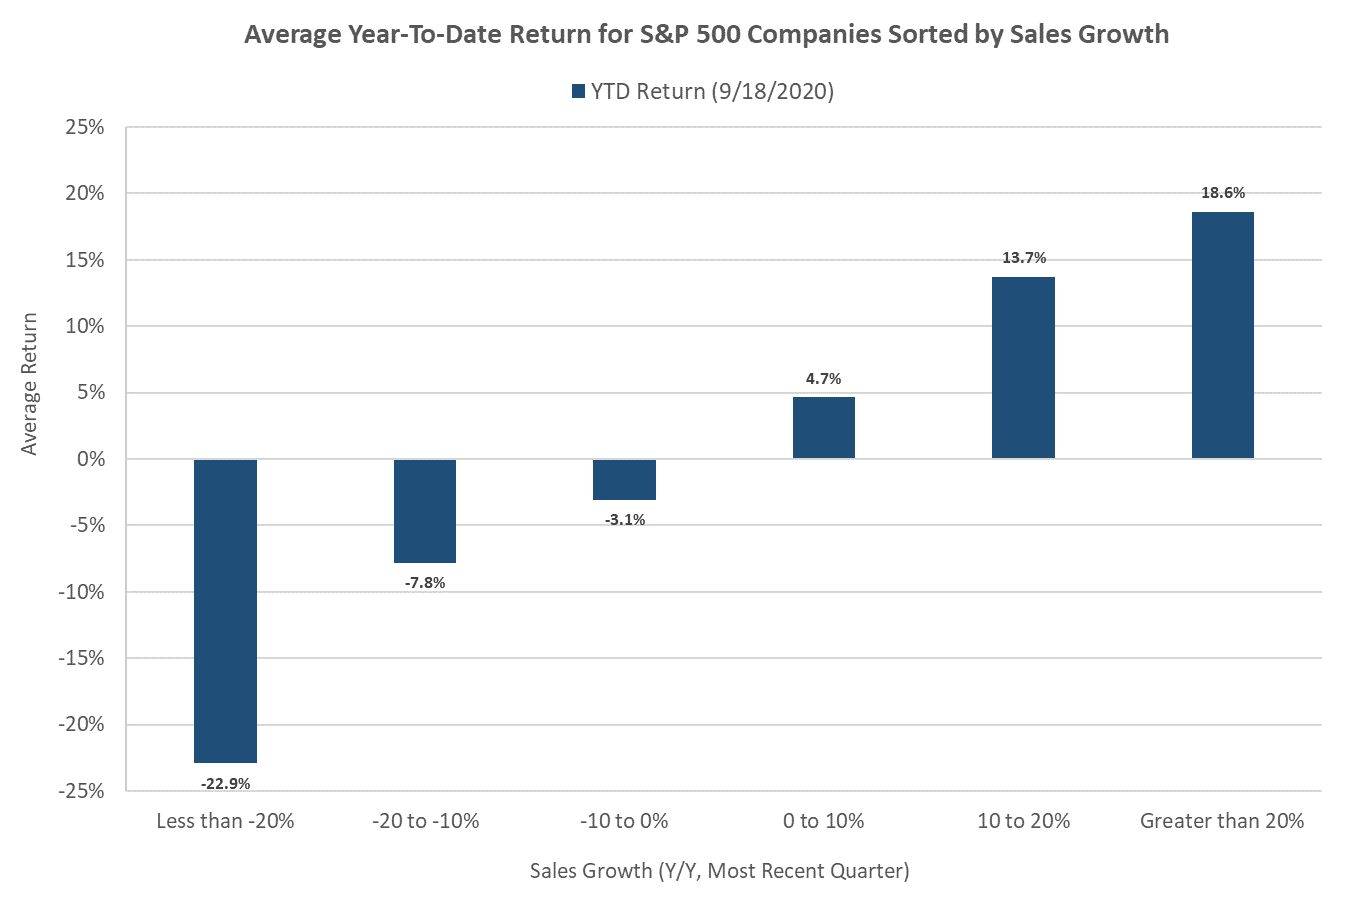
This seems to show much more matching between sales and returns than our stock market sceptics would have us believe. Companies that have seen sales collapse have seen hugely negative returns. Companies that have seen big jumps in sales, have seen big returns. Companies that are treading water in sales are also treading water in stock returns. It’s hard to see from this data any reason to think the stock market is particularly disconnected from the ‘real’ shape of things.
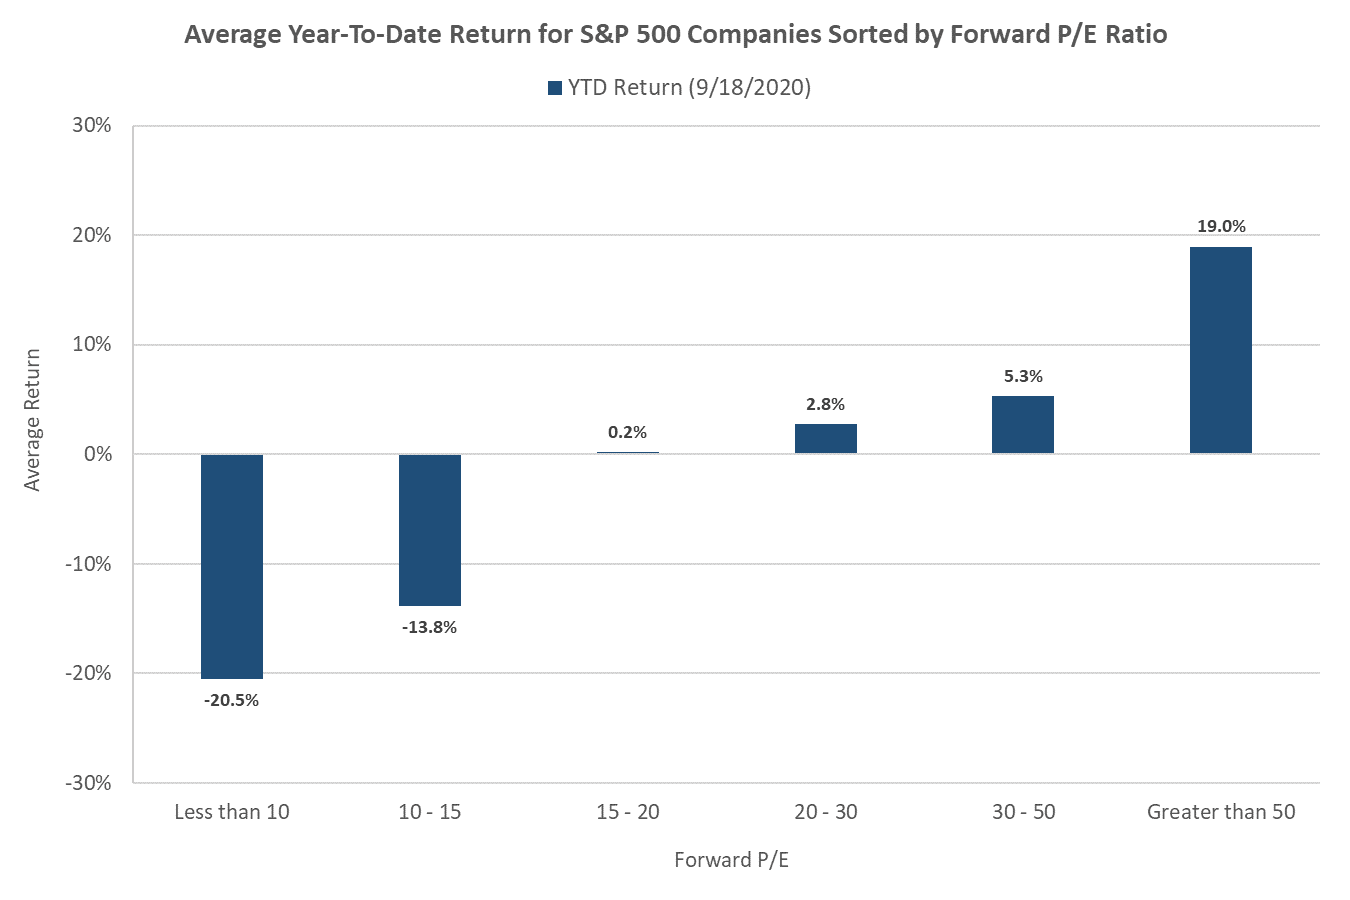
This does not mean that stocks, especially the ones that have really run up in price, are avoiding overvaluation. However, that is a different question. If there are overvalued stocks, it is likely caused by companies that have seen the biggest sales growth leading to overoptimistic expectations of future sales growth. Overconfidence reflects the economy and beliefs about the economy, while none of us know the future. But this is a generic point, not an argument for setting aside consideration of the stock market. Stocks with the highest valuation, as measured by forward price to earnings ratio, have in fact gained the most year-to-date.
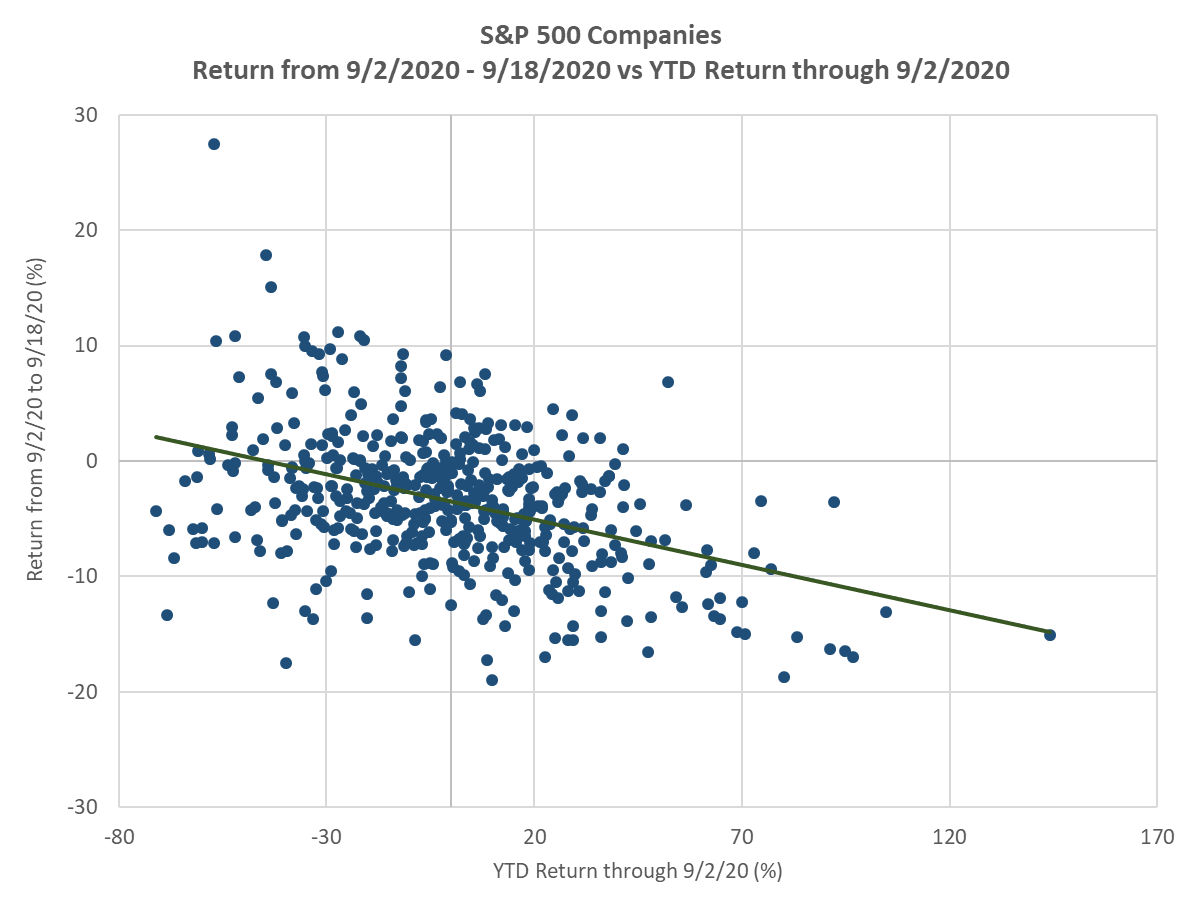
Meanwhile, the momentum has flipped in the other direction over the course of September. Stocks that were up the most year-to-date, through 9/2/2020 fell the most on average as of 9/18/2020. If at some point this year Federal Reserve interventions propped up the stock market by “financing speculation”, it doesn’t seem to be now.
Of course, if the stock market doesn’t do a great job of capturing the fortunes of small businesses, it really doesn’t do a good job of capturing how well workers are doing. But workers are not the economy. If people really mean that the stock market doesn’t reflect workers' economic circumstances, they should say it. That mismatch is also something that’s obvious, and clearly true all the time. Even here, overall sales were supported by the now expired ‘stimulus’ checks and supplementary unemployment benefits, as Joe Weisenthal pointed out six weeks ago.
To the extent those elevated sales represented labor’s economic circumstances, the stock market reflected it. Without making any predictions, it’s likely the stock market will continue to reflect sales as they taper off. More generally, workers do tend to benefit from high sales growth. Those factors spill over into a tighter labor market, as J.W. Mason’s new paper points out. The lesson here is that to understand what’s going on, we have to peer past the price indices, and examine the stock market in far more detail.
Sign up for Notes on the Crises
Currently: Comprehensive coverage of the Trump-Musk Payments Crisis of 2025