In April 2014, GDP in Nigeria Jumped 89%. How the Hell Did That Happen?
Understanding Measurement Issues is Key to Understanding ‘Economic Growth’

This is a Guest Article for Notes on the Crises. Thanks to the generous support of our paid subscribers, we can now afford to have guest writers, covering a broad range of approaches and contexts relevant to our current moment of global economic crisis.
Morten Jerven is Professor in Development Studies at the Norwegian University of Life Sciences. He has a PhD in Economic History from the London School of Economics and has published widely on African economic development, particularly on patterns of economic growth and on economic development statistics. His books, including Poor Numbers and Africa: How Economists Get it So Wrong, are based on research in Ghana, Nigeria, Uganda, Kenya, Tanzania, Malawi, Zambia and Botswana.
Publisher Note: I commissioned this piece by Morten Jerven to begin digging into how Gross Domestic Product and Consumer Price Indices are measured. I think this is an important and relevant topic as we begin to struggle with the measurement difficulties that Coronavirus has brought as well as the big changes to consumption behavior that have happened. This is particularly important as “inflation” is often mobilized as a reason to not pursue further economic aid and there is a danger that we will make decisions based on measurement error rather than underlying economic phenomena.
For economic historians, the controversy surrounding the rate of growth during the “British Industrial Revolution” serves as the most famous example of the difficulty of economic measurement. The term “revolution” implies a rapid and sudden upheaval, and thus one would expect the period to be one of rapid economic growth. That was the conventional wisdom. For a time, this assumption was confirmed by economic growth estimates by the economic historians Phyllis Dean and W.A. Cole. This orthodoxy held largely unexamined, until Nicholas Crafts and Knick Harley corrected the measurement problems in the original Dean and Cole series decades later. The new series showed the economic growth during the “British Industrial Revolution” was slow, and sluggish. Perhaps not so revolutionary after all.
Readers may be inclined to expect that the measurement problems Crafts and Harley fixed that would lead to such big divergences were basic and major. In fact, this is a perfect example of a seemingly narrow, complicated and small technical issue of measurement. But also one that meant that the history of economic growth had to be revised, and the narrative of rapid economic growth upended.
The driving force behind what’s termed the “industrial revolution” are likely familiar to you. Few dispute that the textile industry and other steam engine dependent sectors experienced a revolution. But the impact on economic growth of all this depends on the relative importance of these sectors in the period in question. If the manufacturing sector grew at 10 percent per annum, but only accounted for 1 percent of the activity in year 1, then its impact on aggregate will not be 10 percent — but 0.1 percent. On the other hand, if the sector was accounting for 10 percent of the economy then its growth impact would have been to raise the size of the total economy by one whole percent. This is what’s known as an “index number problem”.
The measure of economists- Gross Domestic Product and Inflation- reduce economic phenomena to one clean simple number. This makes them easy to distort if you overvalue or undervalue their underlying subcomponents. It is all about the weighting. Economic growth and inflation may seem clear and easily identifiable when looking at their abstract definitions. The total sum of economic activities transacted on the market is the size of GDP. The change in inflation is then measured by all the changes in all the prices, and goods transacted from one period to the next. The difference by the two across the same period is “real” economic growth.
You get the GDP deflator, which is one way of expressing inflation, by dividing all the goods and services in one year at current prices, divided by the same goods and services at the previous period prices. So far, so simple. But in practice this is constrained by data availability. This data availability constraint can have quite serious implications. Let us fast forward from the industrial revolution, and to a Sunday afternoon in Abuja, Nigeria in April 2014.
Yemi Kale, the director of the Nigerian National Bureau of Statistics took the podium, and announced that the Bureau had revised their GDP figures. The base year for the national accounts was updated, and the new figures showed that Nigerian GDP was 89 percent higher than previously estimated. Given the relative size of the Nigerian economy for the region, this was quite a revision. That afternoon, Sub Saharan African GDP increased almost 30 percent. Economic activity equivalent to 58 times the size of the Malawian economy was added to the Nigerian economy.
To understand what happened, we need to dig a bit deeper into how GDP is actually calculated in practice. As already explained, GDP is typically calculated as a sum of the "value added" of the production of goods and services, across all sectors of the economy. We must compare one year's value added with another, to get an idea of whether the economy is expanding or contracting. For this purpose, a new set of sums for all the sectors are computed.
In order for these two amounts to be comparable, they are expressed in constant prices. In many countries, this is done by always comparing one years GDP, with the GDP at the previous year’s prices. But there is no data availability to make such calculations every year.
The easiest way of doing this, particularly if data are sparse — which they are at most African statistical offices — is to generate "base year" estimates for future level estimates. When picking a base year the statistical office chooses a year when it has more information on the economy than normally available. This includes data from a household, agricultural or industrial survey. The information from these survey instruments is added to the normally available administrative data, to form a new GDP estimate. This new total is then weighted by sectors, thereafter other indicators and proxies are used to calculate new annual estimates.
It might be that for some sectors, such as the construction sector, there is very little data to access. So here, a level estimate is accepted. To calculate growth from this level, a simple indicator is used — such as cement imports or population growth — to estimate growth in this sector going forward.
The base year is very important in three respects. Firstly, the GDP estimates will be expressed in constant prices for the base year. Second, the index number applies, so that a sector that was very economically important in the base year will continue to appear very important. This holds true despite structural changes that may have occurred since the last base year. Conversely, sectors that were unimportant — or not even existing — will barely have an impact on the official statistics. In other words, we lose track of national economies quite quickly, as their various sectors rise and fall in prominence.
Finally, the data sources and the use of proxies are set in the base year. Even when new information is becoming available, national accountants may be unwilling or unable to add this data to the GDP series.
Thus, when the base year is out of date, the GDP series becomes an increasingly unreliable guide to interpreting underlying economic change. For instance when the Nigerian GDP was recalculated, a quarter of a century had passed since the previous base year of 1990.
What do we now know of economic performance in Nigeria or Sub-Saharan Africa? It is a bit complicated. We know now that Nigerian GDP was, according to the revised figures, underestimated by 89 percent. When did this new economic activity appear? That would require some serious forensic accounting to establish. Sadly, the data sources are not good enough to figure it out. Unrecorded remains unrecorded.
So what then is the right thing to do about this newly discovered economic activity in Nigeria? There is now a break in the series with a sudden 89 percent increase. The National Bureau of Statistics in Nigeria is too resource constrained to focus on getting the history right, and has to focus their attention on getting the next year's estimate in order. Thus, the thankless task of the assistants working at the World Bank data group — to decide where to put this windfall of economic activity.
I downloaded the data on African GDP growth before the revision, then again after the revision from the World Bank’s database. The orange line marks how the database records growth before the revision. The blue line shows how growth is recorded after the 89 percent was added. The sheer increase of 89 percent in Nigeria’s economy amounts to 15-20 percent of GDP in Sub-Saharan Africa. They could have either lumped it all in in 2014, or just kept all growth rates and increased the 1960 level. Instead, the database opted to push it a decade back. The old growth rate for Nigeria in 2004 was about 4-5 percent. It is now an incredible 34 percent.
This affects the growth rate across the continent, and the new growth rate – and the highest recorded growth yearly growth recorded in Sub-Saharan Africa – 2005, with its 9.5 percent growth. I feel for the new generations of scholars of economic development, who will duly struggle to explain this explosive growth in 2004. This will presumably be attempted not knowing that this has nothing to do with economic development in Nigeria or Africa. But is rather recording what took place at the World Bank Data Group Offices in Washington DC.
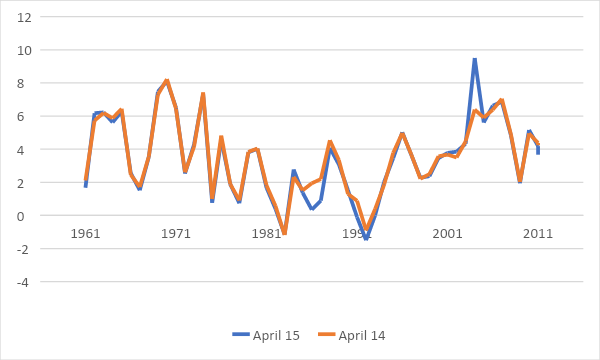
Source: World Bank, World Development Indicators.
The advantage of coming at the problem of economic statistics as an Economic Historian is that one is keenly aware that the statistics are not given, they are made. That means that statistics are social and political products. In mainstream economic debates the biggest part of the discussion is focused on what drives inflation, and why employment is up or down. Meanwhile less attention is given to the very basic problem that while we know what employment and inflation are in theory, it is technically impossible to measure it cleanly.
The notion that we scientists can let the data or the evidence speak for itself is misleading. Skilled journalists, historians and lawyers interrogate witnesses and sources to figure who made the observation, and the biases behind what they observed. And in our own way,, economists and finance writers have to interrogate these soft numbers that we too often treat as hard facts.
Sign up for Notes on the Crises
Currently: Comprehensive coverage of the Trump-Musk Payments Crisis of 2025